How data usage spiked during the Women’s World Cup
In today’s digitally drenched world, where people are more connected now than ever before, it comes as no surprise that data usage is on the rise, especially during globally recognised events such as the Women’s World Cup.
There has been a significant shift in the way data is being consumed, which is only heightened during key sporting events or national holidays. Many reports are now finding that more and more audiences are opting for online streaming services, placing a higher demand on the UK’s fixed line and mobile networks. Whilst mobile viewing offers true flexibility to the viewer, it can also lead to unexpected costs, particularly with inflexible tariffs or when using data abroad in destinations that attract high roaming charges.
Using anonymised data from our proprietary billing platform, we analysed the data consumption across all of our customers during the Women’s World Cup to determine the impact on usage.
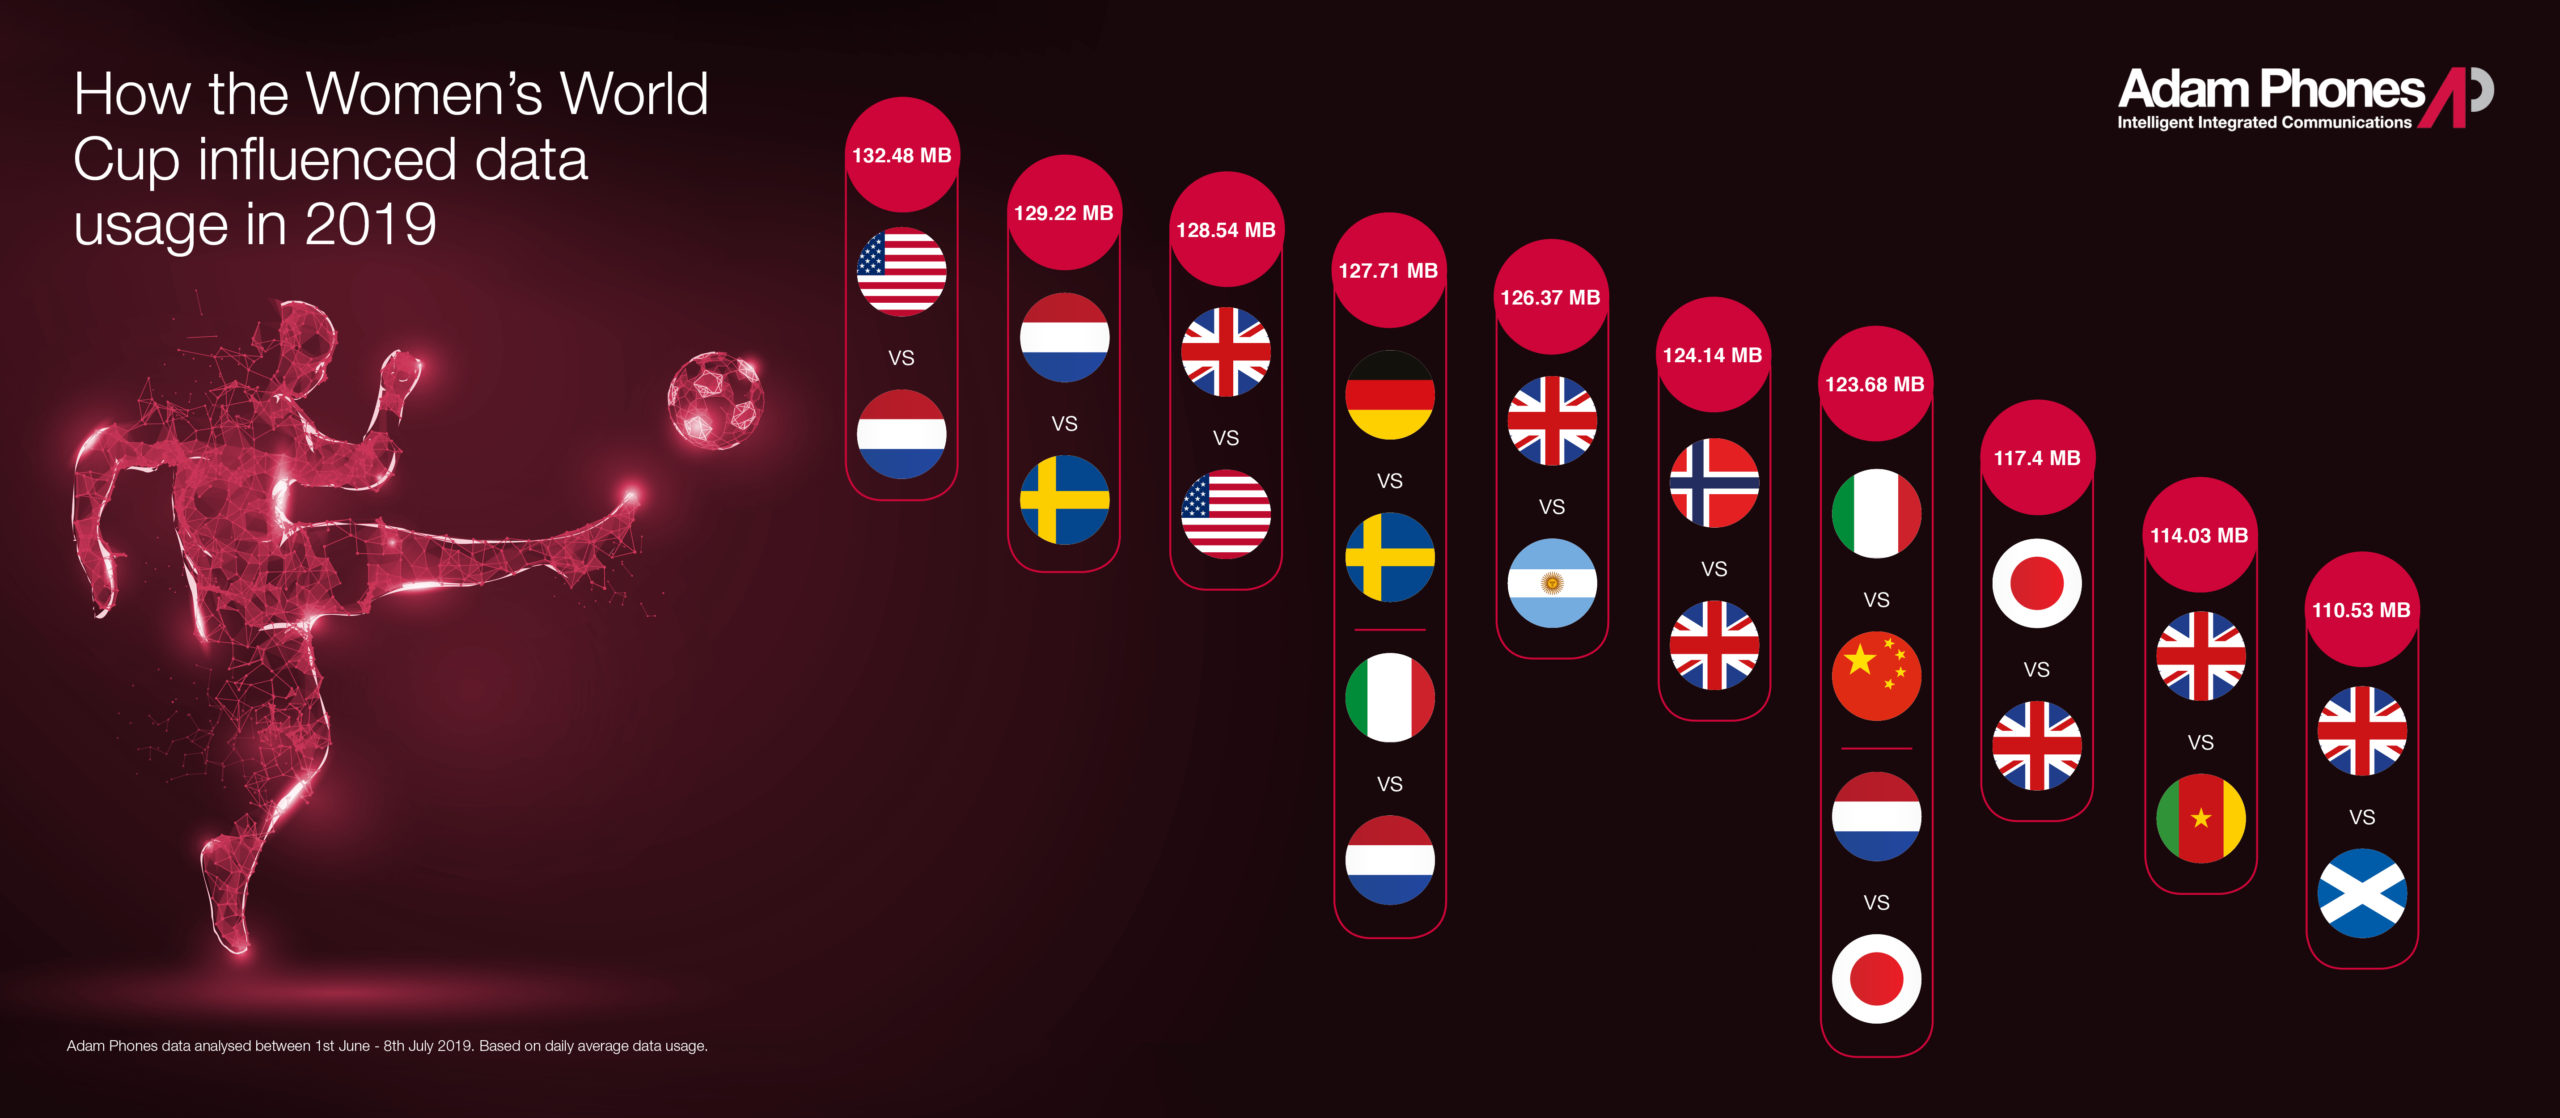
Unsurprisingly, mobile data usage peaked during the final between USA and the Netherlands on 7th July, closely followed by the Netherlands and Sweden semi-final on 3rd July. Both dates represented the highest average daily data use over the full six-week event.
Other peak dates over the Women’s World Cup period coincided with all of the England games, closely followed by dates where the USA or Italy were playing.
Data usage overall was up in June from May, suggesting that content consumption was elevated overall throughout the month (even on non-sporting days) where perhaps the fan fair and supplementary content around the World Cup event spiked our interest.
As a final take out, we can only speculate how much more data we might have consumed on 5G.
With an ever-increasing upward trend for the amount of data consumed per user, it is imperative for businesses to maintain control of telecoms spend. The Adam Phones Portal offers a comprehensive suite of online tools that enable customers to instantly see costs and usage across their mobile estate for both voice and data. Alerts can be set when chosen limits are reached for a data pool as a whole, for example, or when individuals exceed certain thresholds. Graphical month-to date usage illustrations also forecast future consumption to assist decision making, ensuring our customers are empowered with the right information to make the most effective business decisions; avoiding the risk of bill shock.
For more information on how Adam Phones can help you with preventing bill shock or to improve the visibility of your mobile estate and costs, get in touch or visit www.adamphones.com.